Now this? The last publication in New England Journal of Medicine declared that the long-suffering Astra Zeneca vaccine was inefficient against the South African variant B.1.351. More specifically, the numbers of those who developed mild-to-moderate Covid-19 were 23 of 717 placebo recipients (3.2%) and 19 of 750 vaccine recipients (2.5%). Out of these 42 individuals, 39 contracted just B.1.351, so that the results should convey loss of efficacy against the new variant.
However, the study demonstrated a different thing instead: an example of underpowered study. When the sample size is insufficient, it would be unable to answer the research question. This is a pretty old statistical wisdom, although often neglected in biomedicine due to urgency, lack of time and resources etc.
The major practical reason for the lack of statistical power is usually too small sample size or, as it was here, too few cases, i.e. the numbers of actually infected participants: around 3%, due to the rather short time interval (median follow-up time was 121 days as of January 15, while the majority of new cases must have fallen on the last 8-9 weeks, i.e. since the emergence of B.1.351 in the country).
Well in advance, WHO required that efficacy of any new anti-Covid-19 vaccine should exceed 50%. In simple terms, the fraction of infected in the placebo group should be at least double the fraction of the vaccinated. Indeed, in this study the efficacy was 21.9%, with 95% confidence interval [−49.9%; 59.8%]. Alternatively, the p-value calculated on the same data would be 0.54, i.e. efficacy was indistinguishable from zero.
How much can we be certain that the low power is behind the negative result of the study? I modeled p-values potentially achievable when the number of participants would be multiple (factor 1, 2, 4, 8, 16, or 32) of the actual N=1000 vs. N=1000 “intention-to-treat” numbers in the both groups (~25% of which were later excluded from the study, hence the final N=717 vs. N=750):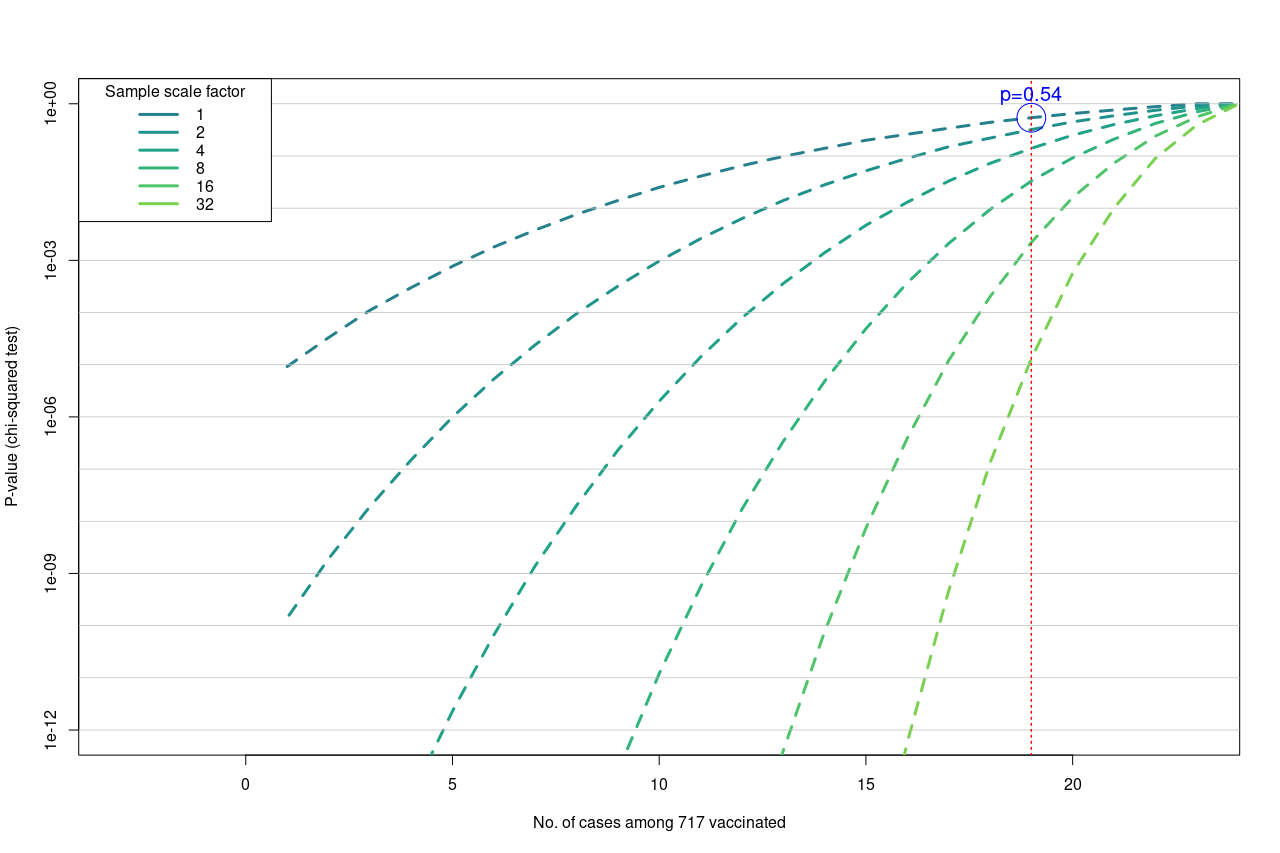
Each line is drawn along the same fraction of infected in the placebo group n=23, while decreasing n in the vaccinated group, i.e. efficacy growing from right to left. The vertical red line denotes the observed fraction, i.e. 19/750=3.2%. We see that with 2 x 16000 participants, the respective p-value would drop under the 0.01 threshold, so that even the modest 21% efficacy would appear significant (while still not sufficient for WHO). For comparison, on the actual sample size this significance level could only be achieved with n=6 infected in the vaccinated group.
What about the 50% efficacy: was it so far away to loose any hope? In fact, the authors admitted that the 50% were still within the reach. The confidence interval which they calculated tells us that the true (actual although unobservable) efficacy is between −49.9% and 59.8% with probability 95%.
Indeed, number n=11…12 desired for claiming 50% efficacy lays close to and is statistically indistinguishable from the observed n=19: p=0.23 and 95% confidence interval [-0.11; 1.33] (note that here it is the interval for n, not for the efficacy as above). What is needed to prove that this fraction is real is a sufficient sample size. Or a longer follow up which would bring more cases (the authors have not broken the blinded study and continue the observations).
God save the vaccine from more premature media headlines. Or from the ugly PR management at Astra Zeneca? Or is it too late already?..